Getting started
Download terNIMA for your computer from its page: the -setup.exe or the .msi for Windows 10 and 11, the .dmg for macOS on Apple Silicon and Intel, and the AppImage, .deb or .rpm for Linux.
Not signed yet. Windows may say "Windows protected your PC": click More info, then Run anyway. macOS may say the app is damaged or cannot be checked: move it to Applications, then run xattr -cr /Applications/terNIMA.app in Terminal. On Linux, make the AppImage runnable with chmod +x, and to use serial ports, add yourself to the dialout group (uucp on Arch).
Each connection is a tab of its own. Above it, the toolbar has the tab's settings and its views; below it, the status bar says what the tab is connected to, for how long, and how many bytes went in and out.
terNIMA remembers its tabs. Close it, and it opens them again as they were, connected if they were, with the window where it was (File > Settings, Startup). When it starts, it looks on GitHub for a new version; Help > Check for updates looks at any time.
Opening a session
The + at the end of the tabs, or File > New session, opens one of seven kinds:
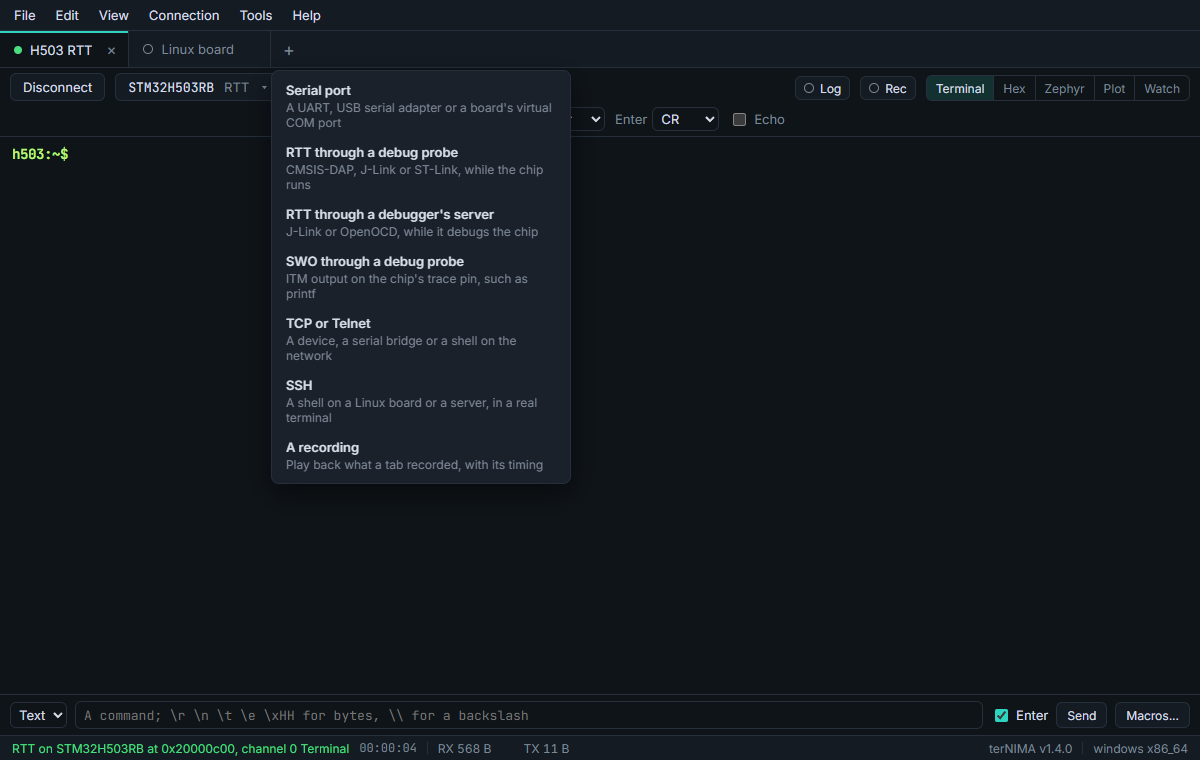
- Serial port: a UART, a USB serial adapter, or a board's virtual COM port.
- RTT through a debug probe: terNIMA opens a CMSIS-DAP, J-Link or ST-Link probe itself.
- RTT through a debugger's server: while your IDE debugs, from J-Link's or OpenOCD's own RTT server.
- SWO through a debug probe: ITM output on the chip's trace pin, such as printf.
- TCP or Telnet: a device on the network, a serial bridge, or a shell.
- SSH: a shell on a Linux board or a server, in a real terminal.
- A recording: plays back what a tab recorded, with its timing.
A tab you closed is under Closed tabs in the File menu, to open again as it was, connected if it was. A new serial session for a device seen before gets the settings its tab had, found by the device's USB serial number.
Serial port
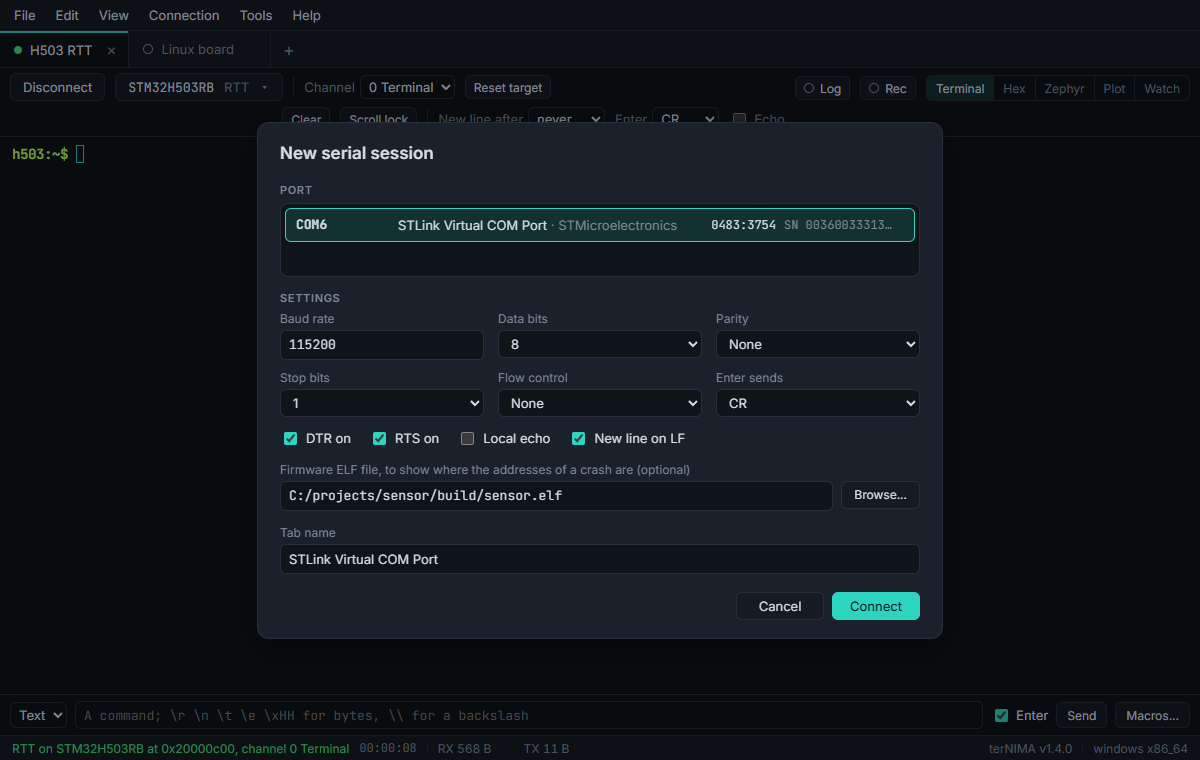
Pick the port. The list shows each port's name, what it is and its USB ids, and follows ports being plugged in and out. Then its settings: any baud rate, 5 to 8 data bits, parity, stop bits and flow control, DTR and RTS, what Enter sends (CR, LF or CR LF), local echo for devices that do not echo, and whether LF alone starts a new line.
The firmware's ELF file is optional. With it, the addresses of a crash get their function, file and line: see Crash decoding.
Unplug the board, and the tab waits for it; plug it back in, and it connects by itself, even on another COM number. DTR, RTS and Break in the toolbar, also in the Connection menu, work on the port as it runs, and Tools > Send file sends a file, paced for the baud rate.
RTT through a debug probe
RTT is SEGGER's Real Time Transfer: the firmware writes into buffers in its own RAM, and the probe reads them while the chip runs, without stopping it. terNIMA reads it through CMSIS-DAP, J-Link and ST-Link probes with probe-rs: no vendor software is needed.
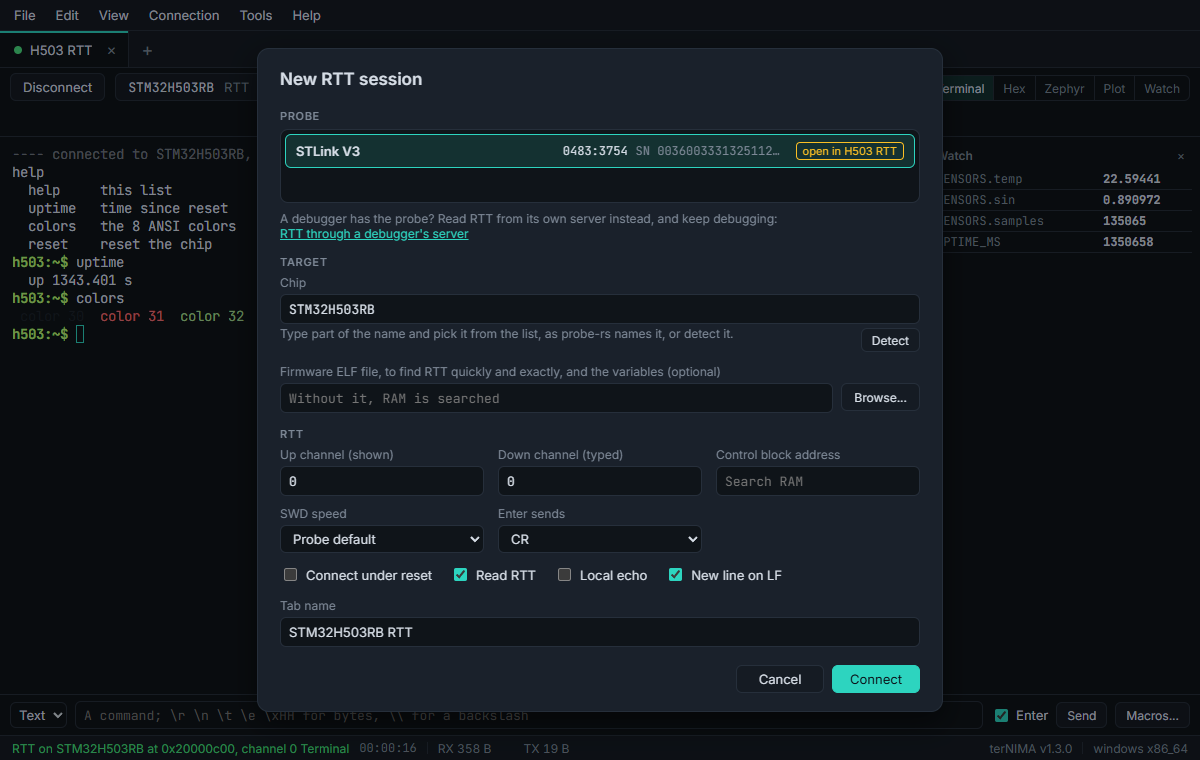
- Pick the probe. One already open in another tab says so.
- The chip, as probe-rs names it: type part of its name and pick it from the list, or press Detect.
- The firmware's ELF file, if you have it: terNIMA finds the control block at once from its
_SEGGER_RTTsymbol, and the Watch view finds the variables in it. Without it, RAM is searched. - Connect.
The up channel is the one shown, the down channel the one typed into; channel 0 is the terminal. Control block address skips the search. Connect under reset is for firmware that sleeps or turns the debug pins off. With Read RTT off, the tab reads only the variables in the Watch view, for firmware without RTT. Reset target in the toolbar resets the chip, and RTT is found again.
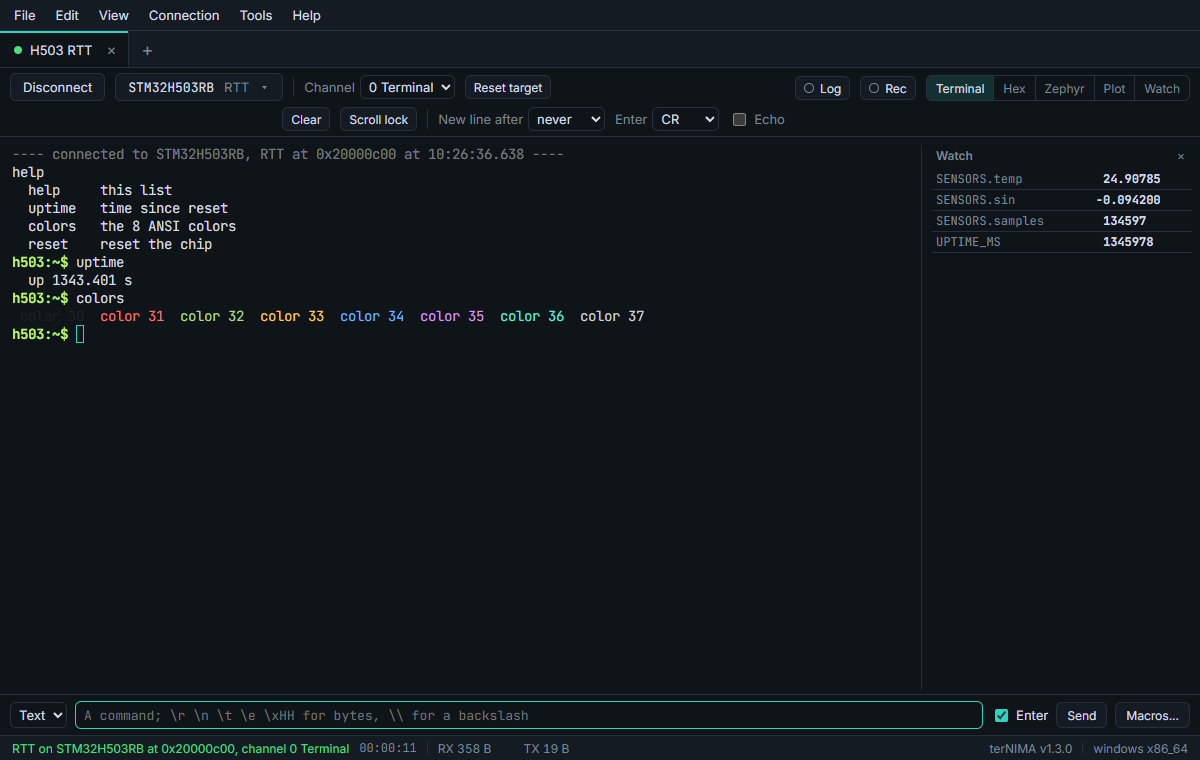
A probe has one owner: while your IDE debugs through it, terNIMA cannot open it. Read RTT through the debugger's own server then, as below.
RTT through a debugger's server
Your IDE keeps the probe, and terNIMA reads RTT from the server the debugger opens. Both work at once.
J-Link
J-Link's software serves RTT on port 19021 while it is connected to the chip: the GDB Server your IDE starts, Ozone, J-Link Commander or RTT Viewer. Pick J-Link's RTT server, localhost and 19021. There is nothing to set up.
OpenOCD
OpenOCD serves RTT once it is told to, after the firmware has set RTT up. Type this in OpenOCD's telnet console, or after monitor in GDB's, with your chip's RAM address and size:
> rtt setup 0x20000000 0x10000 "SEGGER RTT"
> rtt start
> rtt server start 9090 0
Then pick OpenOCD's RTT server, localhost and 9090.
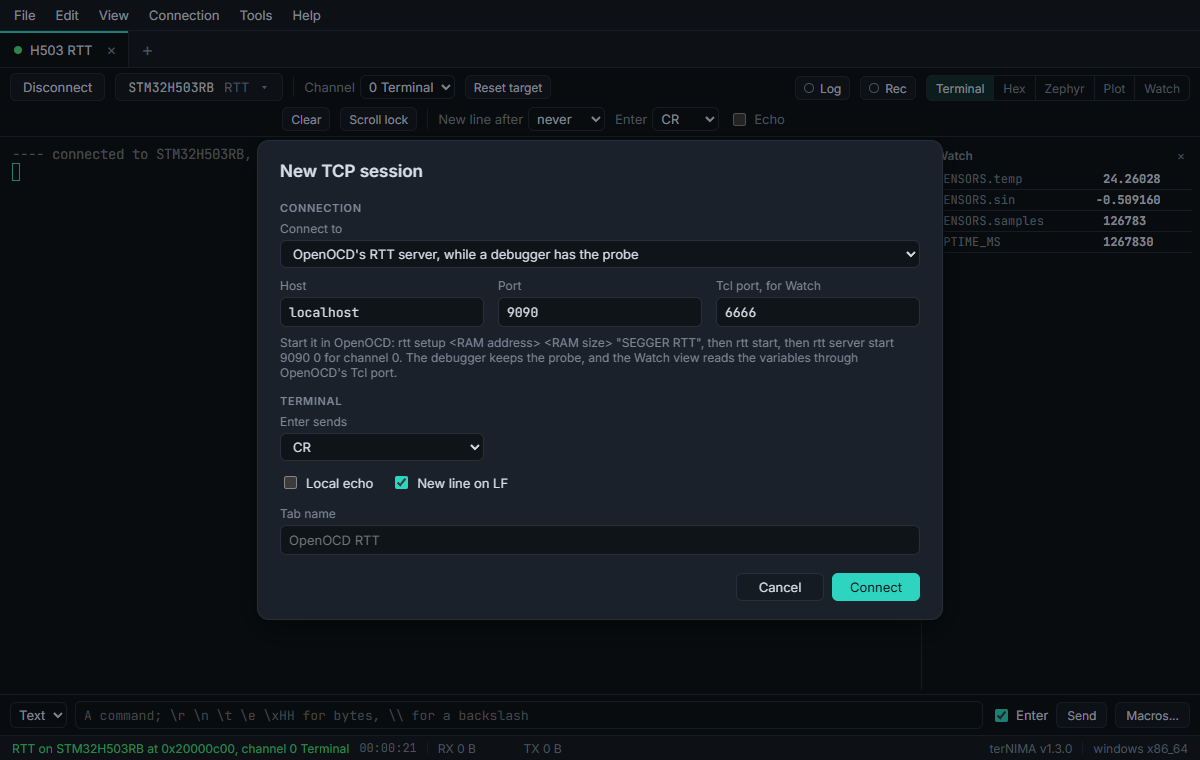
With OpenOCD, the Watch view reads the variables through OpenOCD's Tcl port, 6666 unless OpenOCD is told otherwise. The chip runs on, and the debugger keeps working. J-Link's server gives no way to read them.
SWO through a debug probe
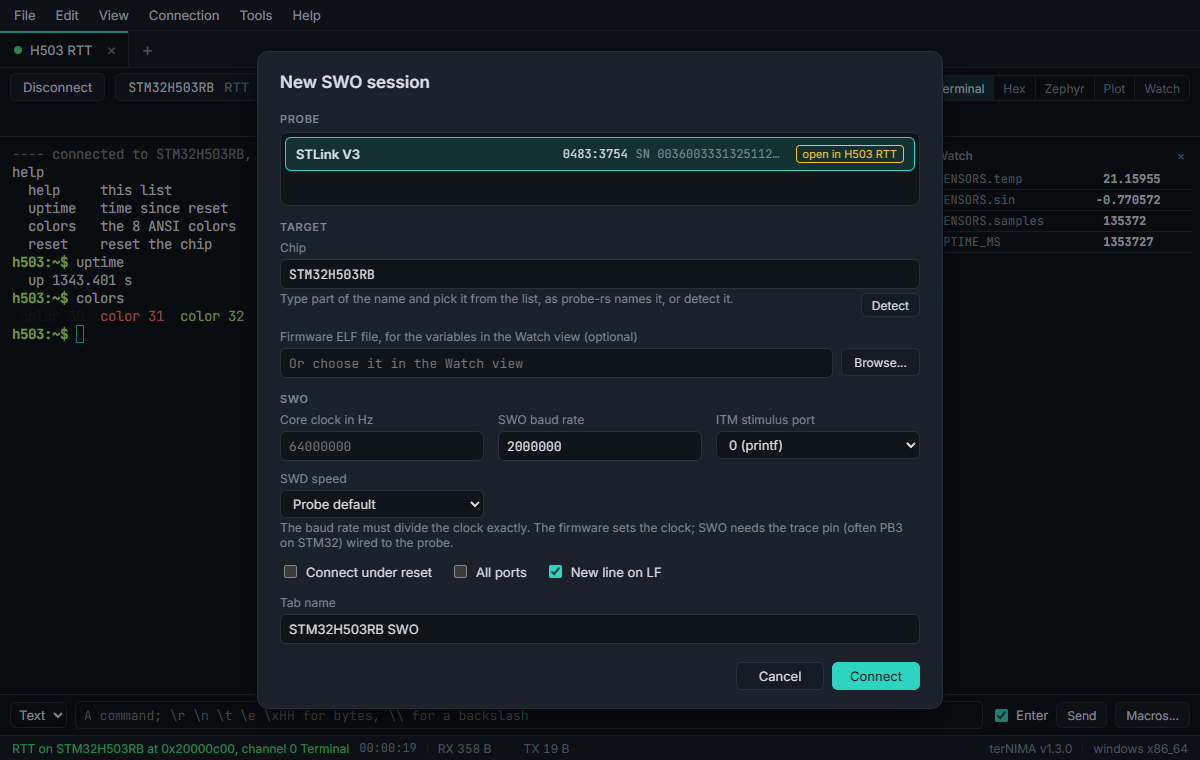
SWO is the chip's trace pin: what the firmware writes to the ITM, such as printf. Give the chip's core clock in Hz and the SWO baud rate, which must divide it exactly, and the ITM stimulus port shown (0 is printf), or All ports. The trace pin, often PB3 on STM32, must be wired to the probe; on STM32H5 terNIMA turns it on itself. SWO tabs have the Watch view too, read through the same probe.
TCP or Telnet
A TCP socket, plain bytes both ways, as from a serial to network bridge or a device's own socket; or a Telnet server, whose option talk terNIMA answers and keeps out of the terminal. Give the host and the port. The tab waits for the other end, and connects again when the connection is lost.
SSH
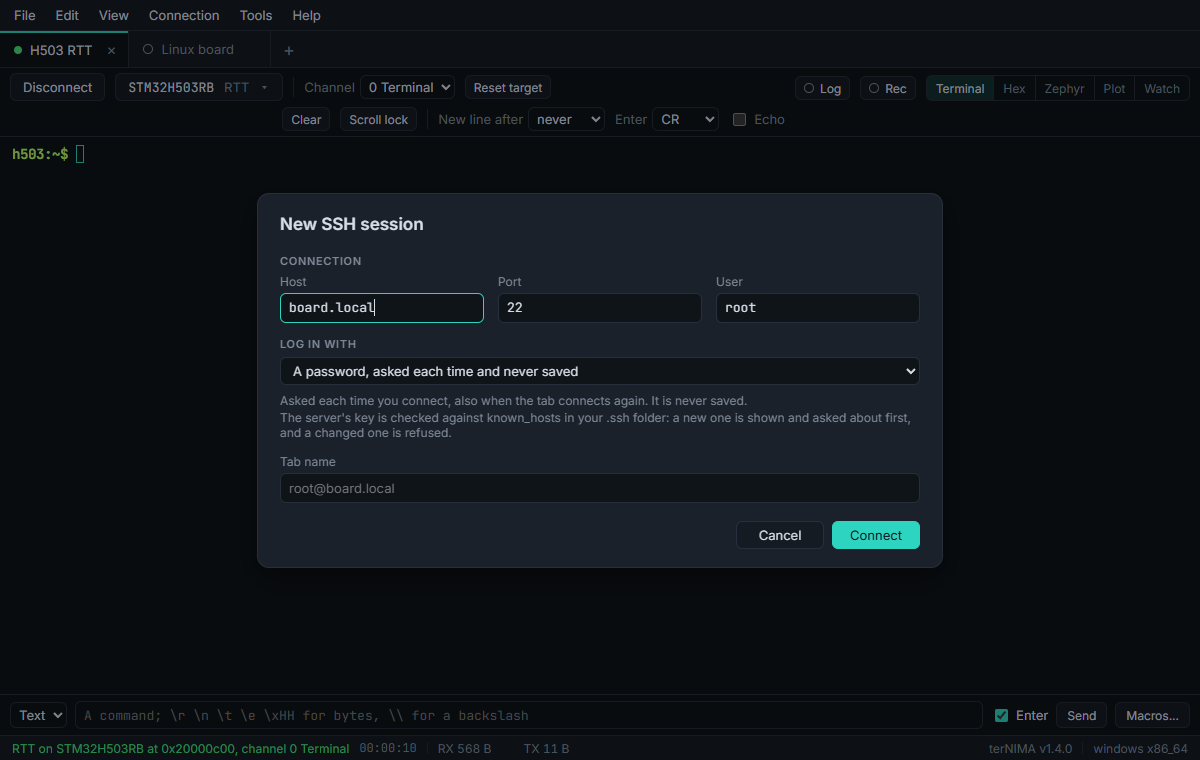
A shell on a Linux board or a server, in a real terminal: colors, vim and htop work, and the size follows the tab. Give the host, the port and the user, and how to log in:
- A key file: OpenSSH's or PuTTY's. A passphrase on it is asked each time, and never saved.
- The SSH agent: OpenSSH's, or Pageant on Windows.
- A password: asked each time you connect, and never saved. A server that asks its own questions is answered the same way.
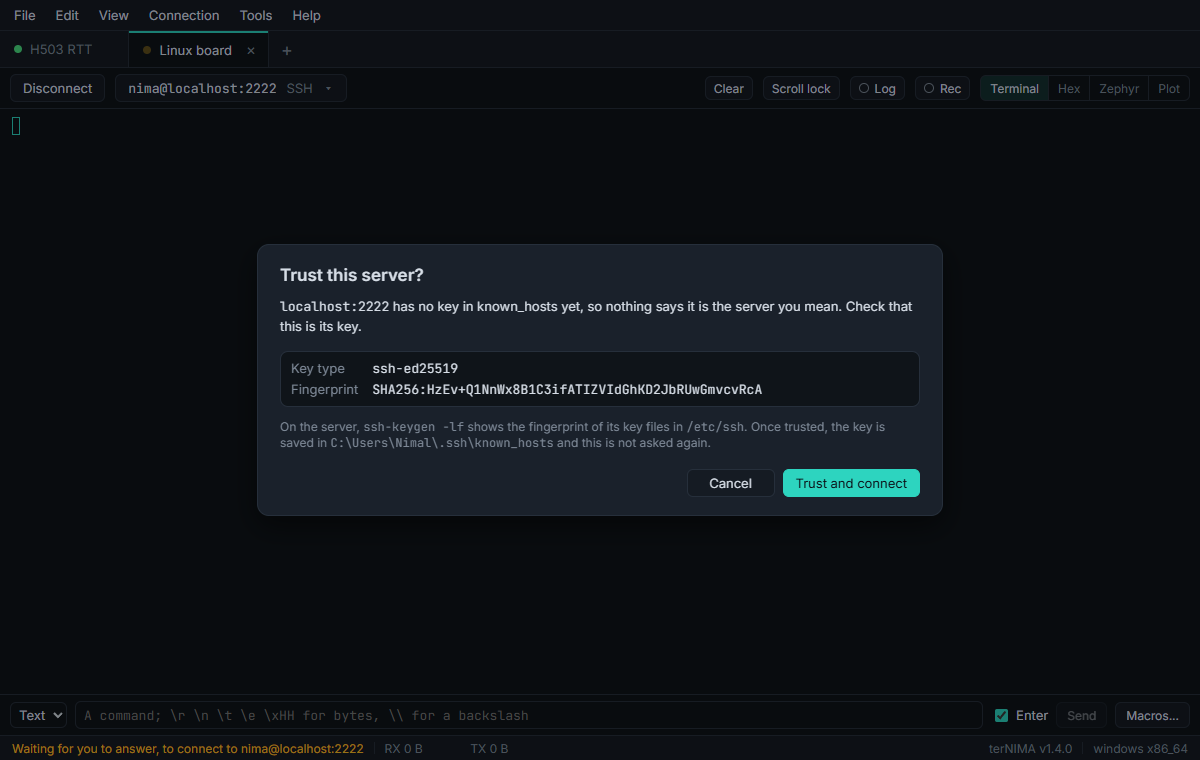
Check the fingerprint with ssh-keygen -lf on the server. A key you trust is kept in known_hosts in your .ssh folder, the file ssh itself uses. A key that changed is refused, with both fingerprints and the command that takes the old one out, for when you know why, as with a board flashed again.
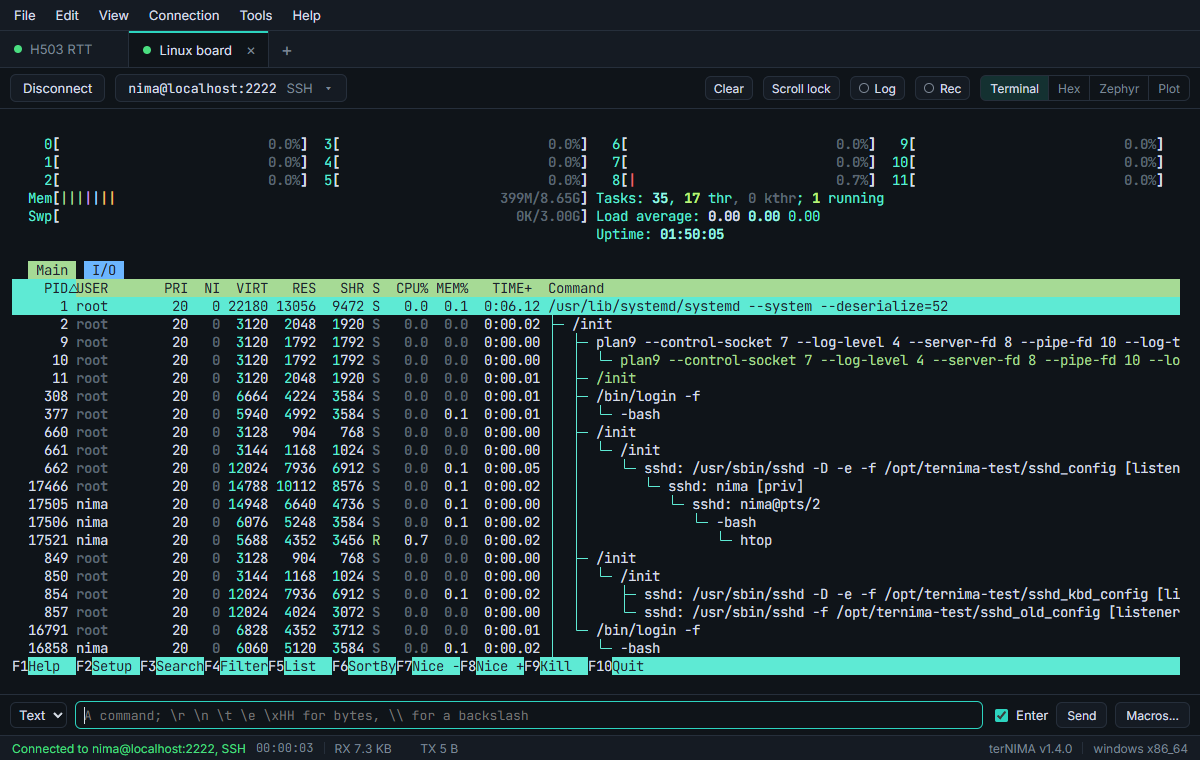
A connection that breaks connects again by itself, and exit ends the session. A login that fails is not tried again by itself, so that an account does not get locked. Log, record and replay, macros, sequences, find and split view work as on the other tabs. A recording keeps all that is typed in the shell, even a sudo password, but never the login itself.
While a full screen program such as vim or htop runs, it gets the F keys, Alt with another key and Ctrl+V for itself, on every kind of tab. Back at the prompt, they are terNIMA's again.
The terminal
A full VT100 terminal with 24-bit color, as a firmware's shell expects it. Above it:
- Clear (Ctrl+Shift+K) empties the screen.
- Scroll lock keeps the screen still while lines keep coming below it; the Scroll Lock key does too. Turn it off, or type, and it follows the newest line again.
- New line after starts a new line when data comes after a pause, for devices that send messages without line endings.
- Enter picks what Enter sends, and Echo shows what you type, for devices that do not echo it.
Copy and paste
As in PuTTY: selecting text copies it, and a right-click pastes. Ctrl+C copies while text is selected, and goes to the device as Ctrl+C when nothing is; Ctrl+V and Shift+Insert paste. Settings can turn either mouse action off. Edit > Find (Ctrl+Shift+F, then F3) searches the output, and File > Save output as (Ctrl+Shift+S) saves it.
The send box, macros and sequences
The send box under the terminal sends a whole line at once: text, which can hold \r, \n, \t, \e, \0 and \xHH, or hex bytes such as AA 55 01. ↑ and ↓ bring back what was sent.
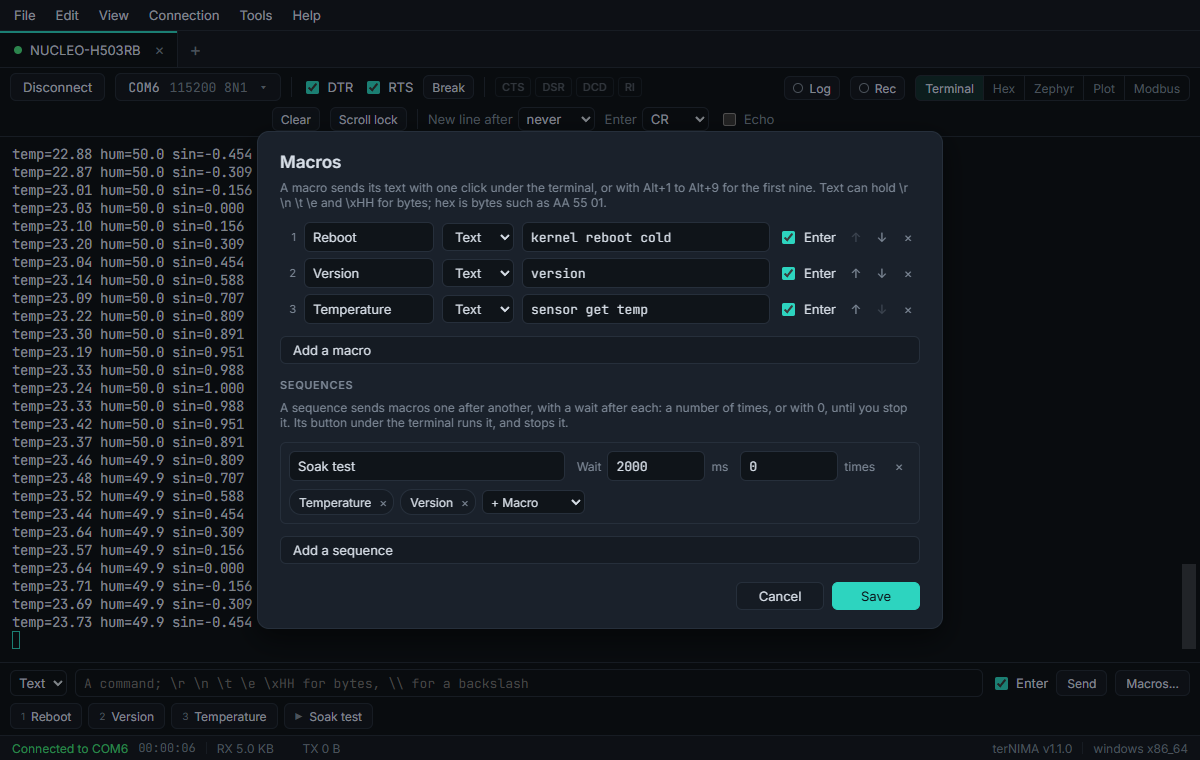
Tools > Macros keeps named commands, as buttons under the send box and on Alt+1 to Alt+9. A sequence sends macros one after another with a wait after each, a number of times or until it is stopped.
Two tabs at once
View > Split right (Ctrl+Shift+E) or Split down (Ctrl+Shift+D) shows two tabs side by side; a click or F6 gives the keyboard to the other one.
Hex view
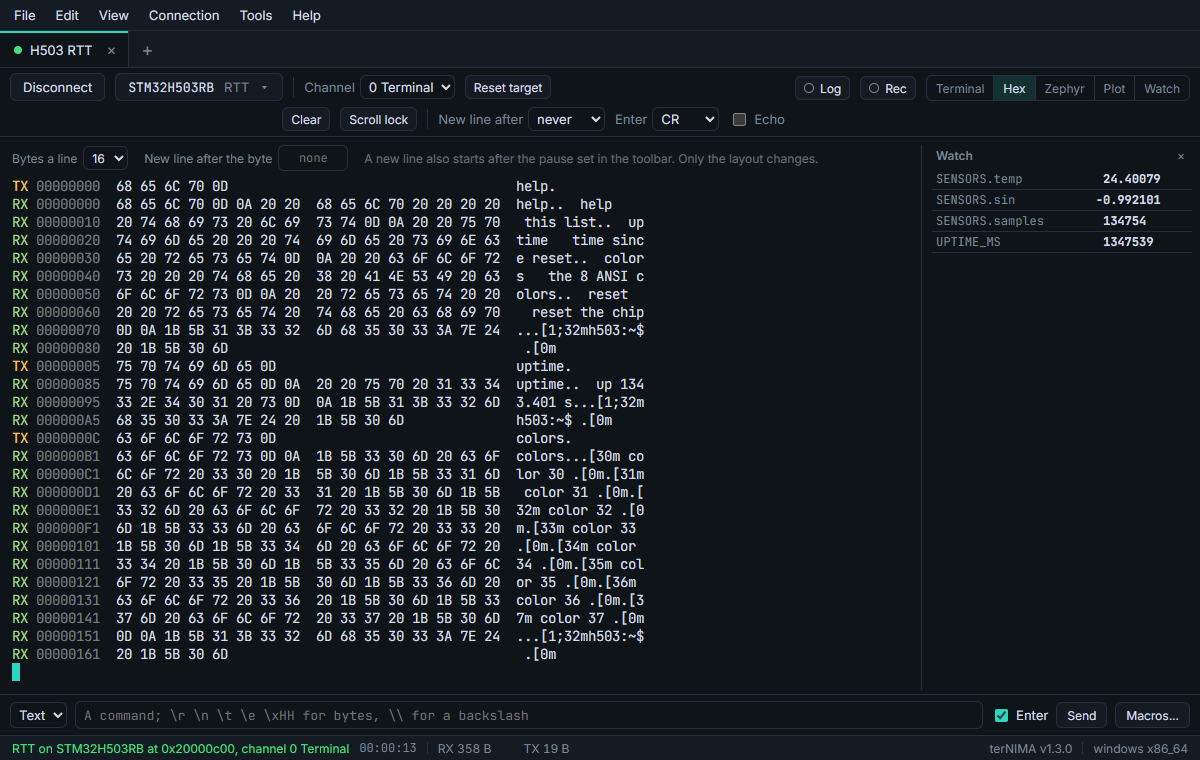
View > Hex (Ctrl+Shift+H) shows every byte sent (TX) and received (RX), with offsets and the bytes as characters. A line holds 8, 16 or 32 bytes, and a new one starts when the direction changes or after a chosen byte such as 0A. The terminal keeps everything while the hex view is shown.
Zephyr log
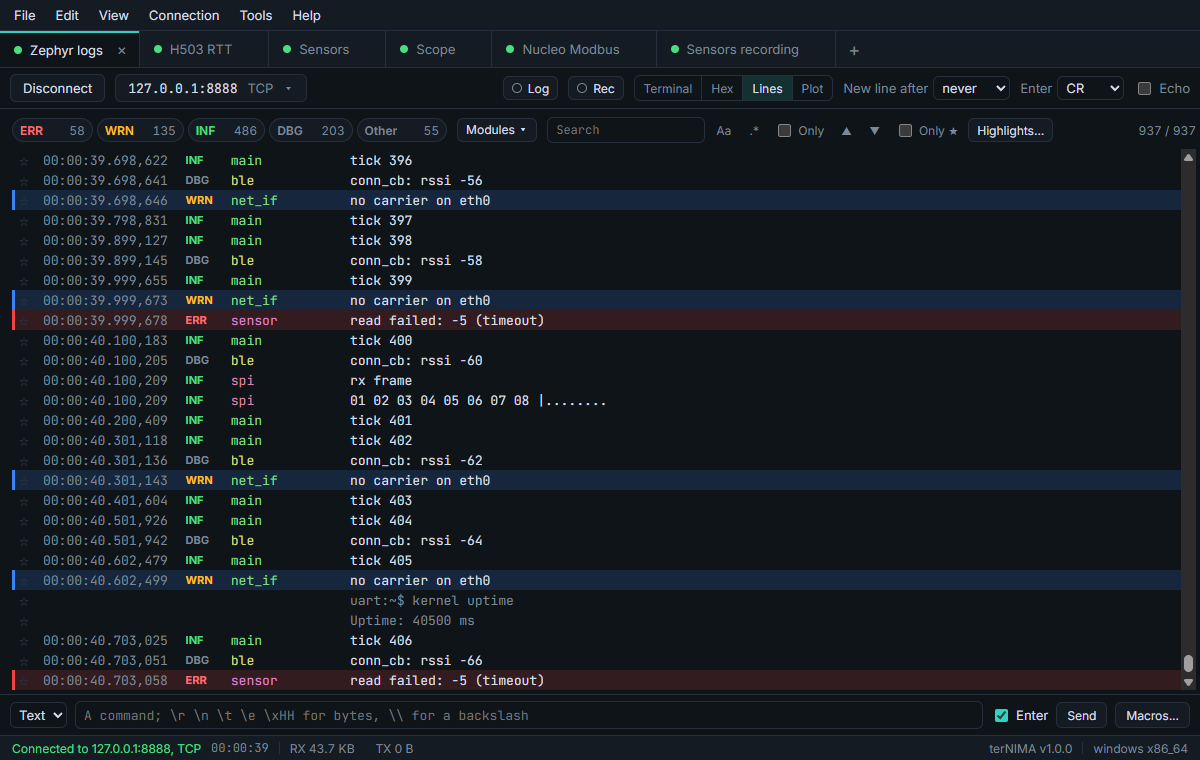
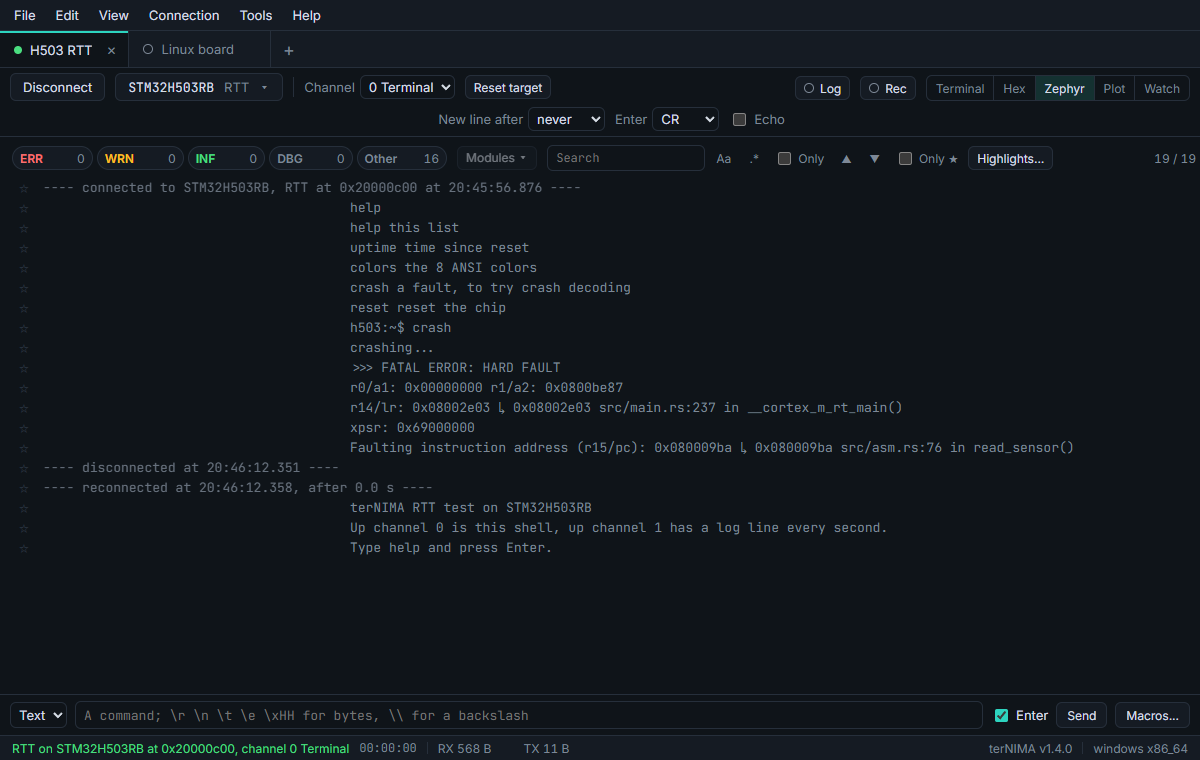
View > Zephyr log (Ctrl+Shift+J) lists every received line, with Zephyr's log lines read into time, level and module. The level chips and the module list show or hide lines, the search marks matches or keeps only them, Tools > Highlight rules colors the lines that match, and bookmarks (Ctrl+F2, then F2 and Shift+F2) mark lines to come back to.
Crash decoding
When firmware crashes, it prints addresses. With the firmware's ELF file in the tab, terNIMA writes the function, the file and the line under each address that is in the code:
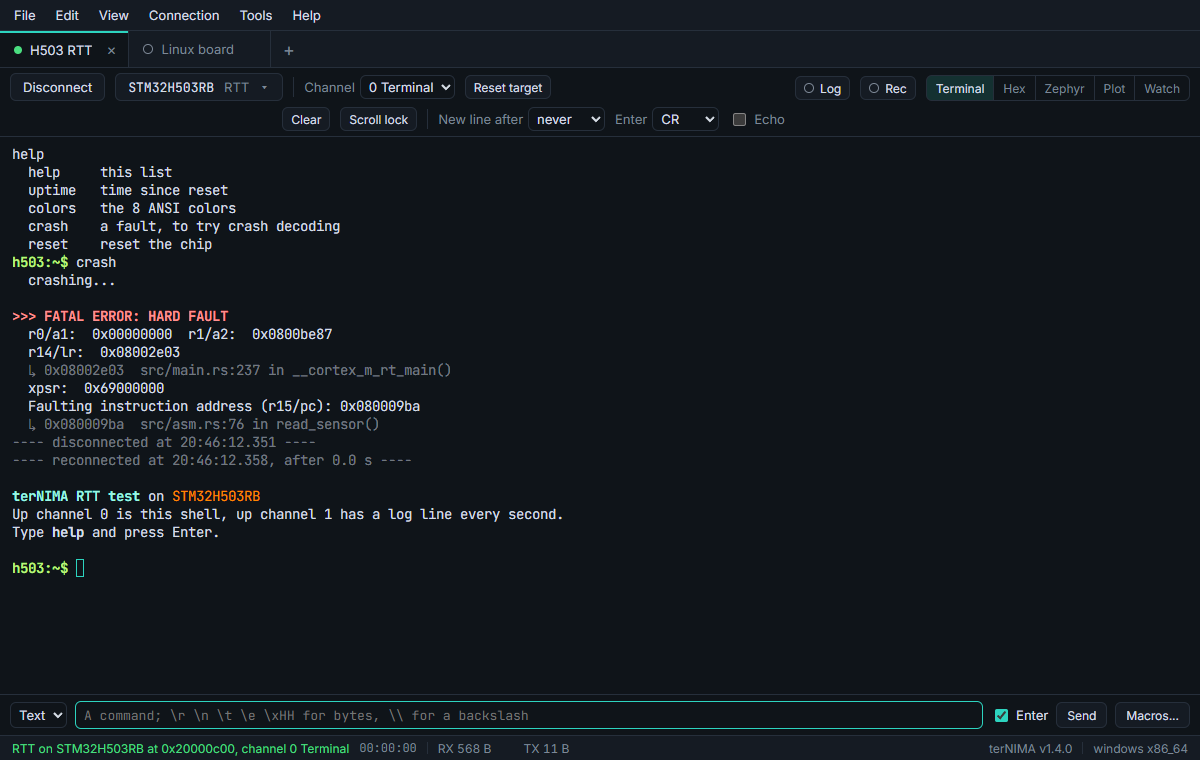
It reads any line with an address written as 0x08001234, as in a Zephyr fatal error, a HardFault handler's print or an ESP32 backtrace. On a line that speaks of the PC, the LR, a fault or a backtrace, 08001234 without the 0x counts too. Only addresses inside the ELF file's functions count, so RAM addresses and other numbers stay as they are. A return address, as in the LR, gives the line of the call.
- Where the ELF file goes: in the settings of a serial, RTT or SWO tab; for a TCP tab, in its Watch view. It needs no probe, and works on a plain serial port.
- Debug information: a firmware built with it, as with
-g, gives the file and the line. Without it you get the function, from the symbol table. A stripped file has neither, and the tab says so. - The right file: it must be the firmware that runs, or the addresses point somewhere else. A file built again is read again by itself.
- The Zephyr view shows them at the end of the line. The hex view and log files keep only what the device sent.
- Settings > Crashes turns it off.
Watch: live variables
Watch reads the firmware's variables as the chip runs, without stopping it: globals and statics, a struct's members as sensor.temp, an array's elements as buf[2], found by name in the ELF file's debug information. Build the firmware with debug information (-g).
- Choose the ELF file in the Watch view, or in the tab's settings.
- Click the box for all the variables in the file, or type part of a name. ↑, ↓ and Enter add one.
- Every sets how often they are read, 10 ms to 1 s.
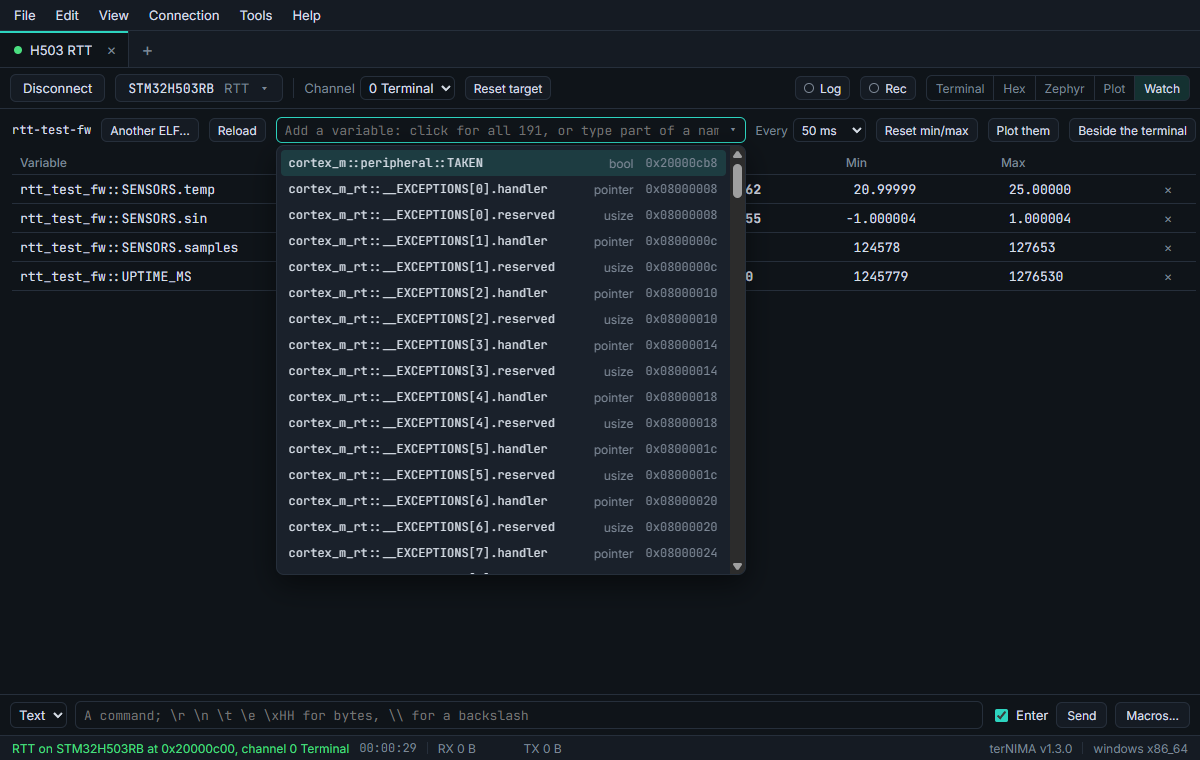
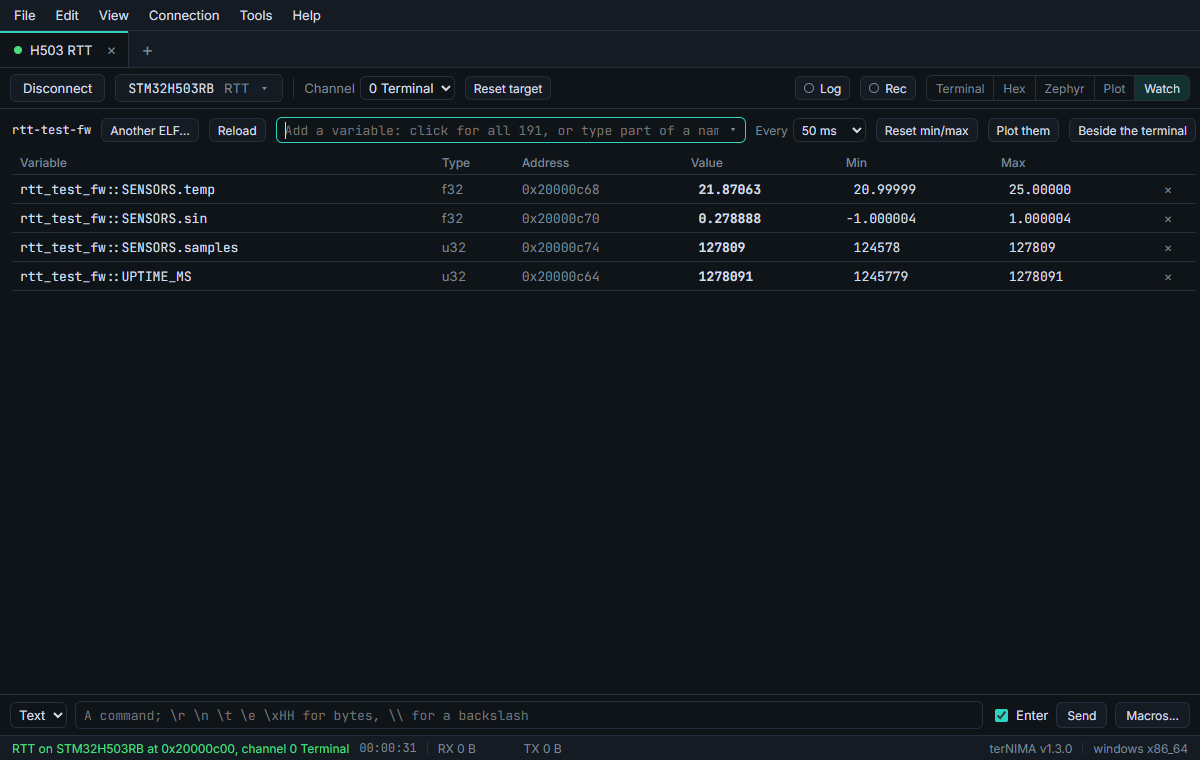
The table has each variable's value, min and max; Reset min/max starts them again. Plot them draws them over time, and Beside the terminal shows them at the right of the terminal, the hex view and the Zephyr log, so what the firmware prints and its variables are in view together:
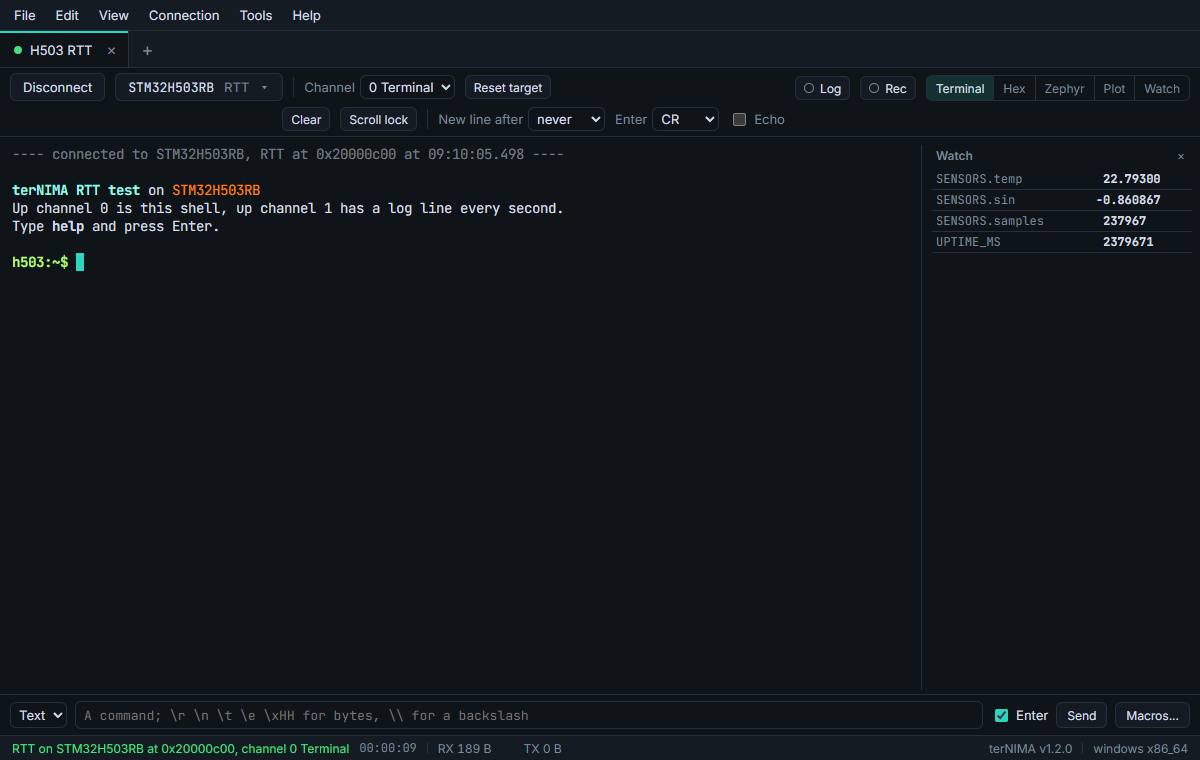
Watch works on RTT tabs, with Read RTT off for firmware without RTT; on SWO tabs; and on RTT through OpenOCD's server while you debug. Statics of one name in two source files are named as GDB names them, 'uart.c'::state. After the firmware is built anew, Reload reads the ELF file again.
Plot
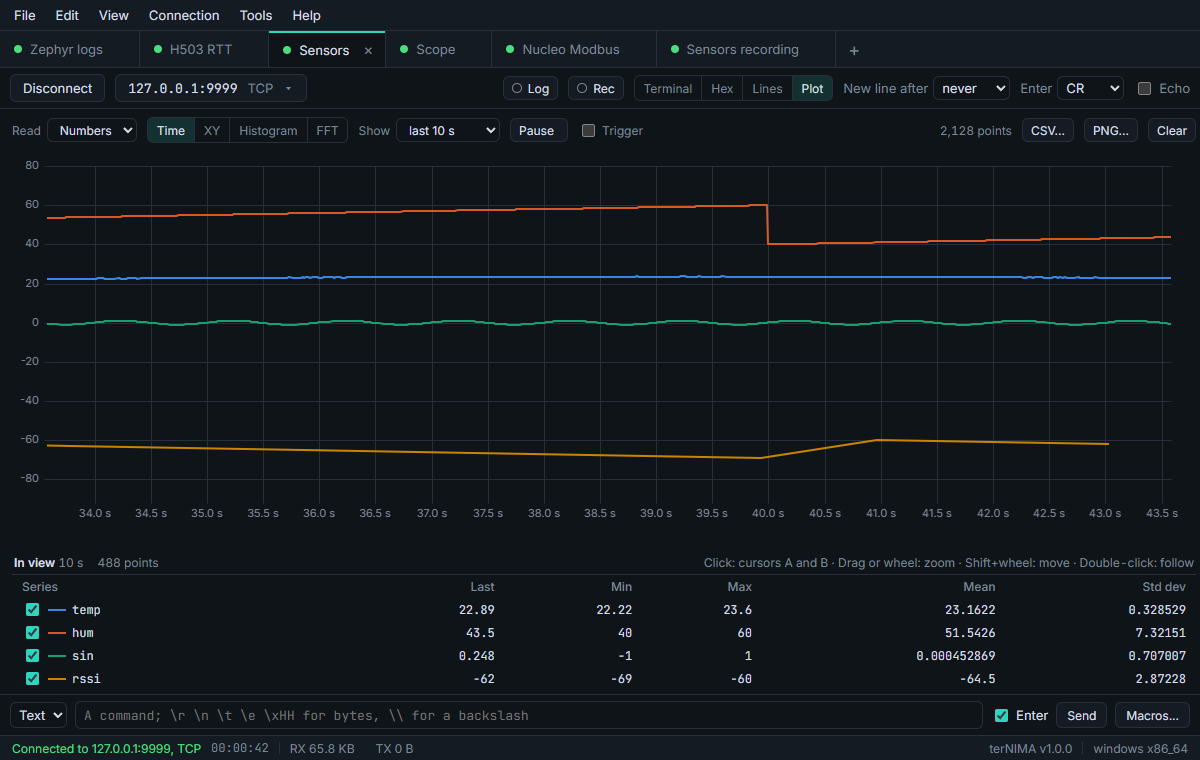
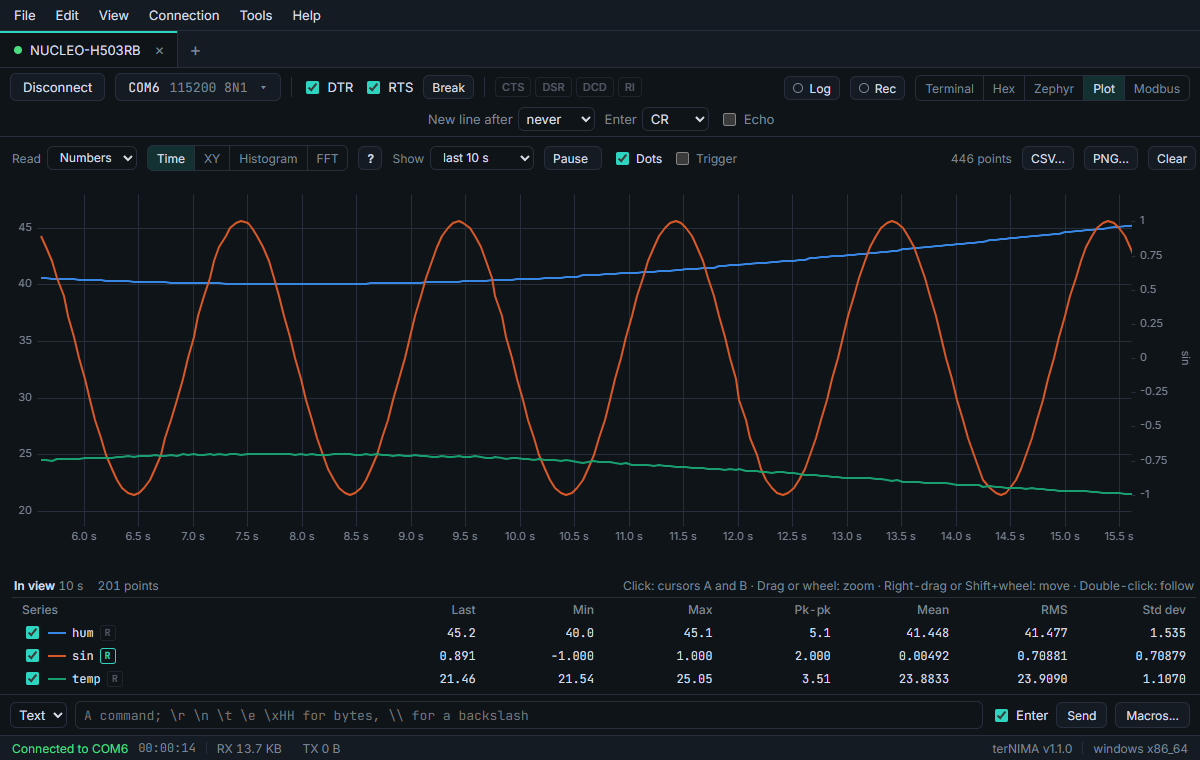
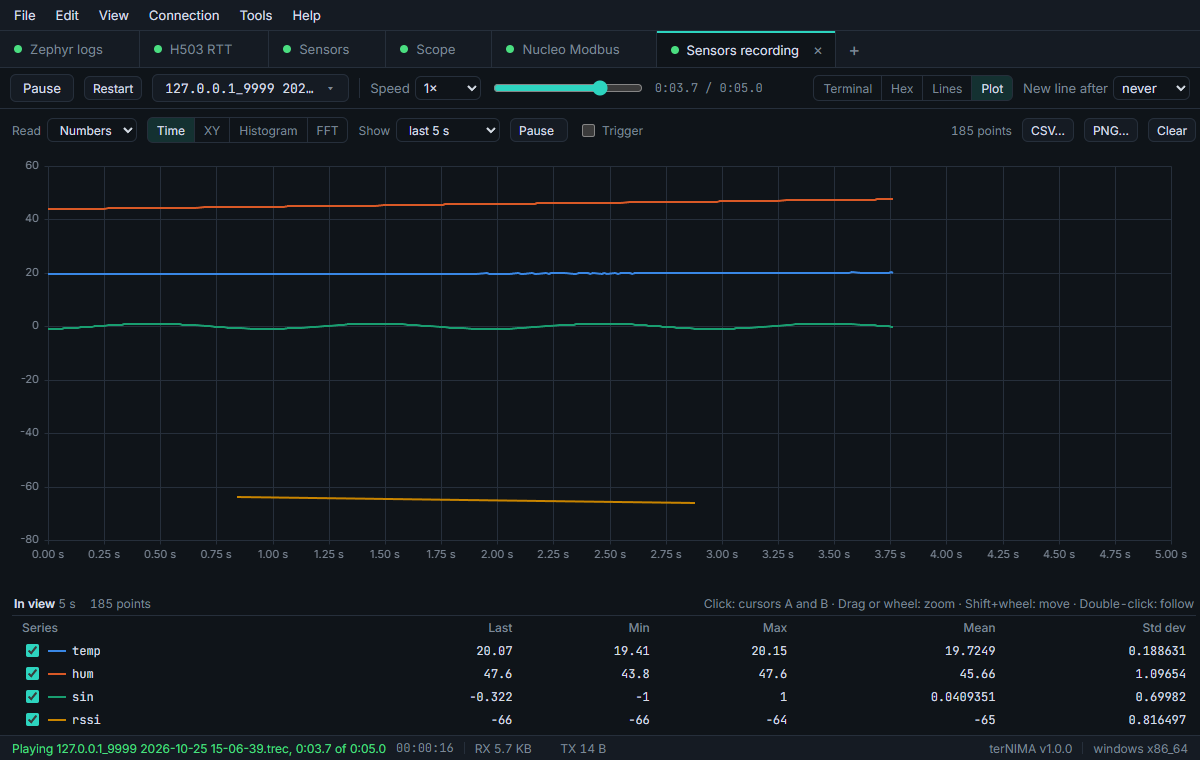
View > Plot (Ctrl+Shift+G) draws numbers over time. Read picks where they come from: Numbers reads named values such as temp=21.5, the Arduino Serial Plotter's temp:21.5,hum:40, plain numbers and JSON lines; Regex takes the numbers your pattern captures; Modbus the values a serial tab's Modbus view reads; Variables the ones Watch reads.
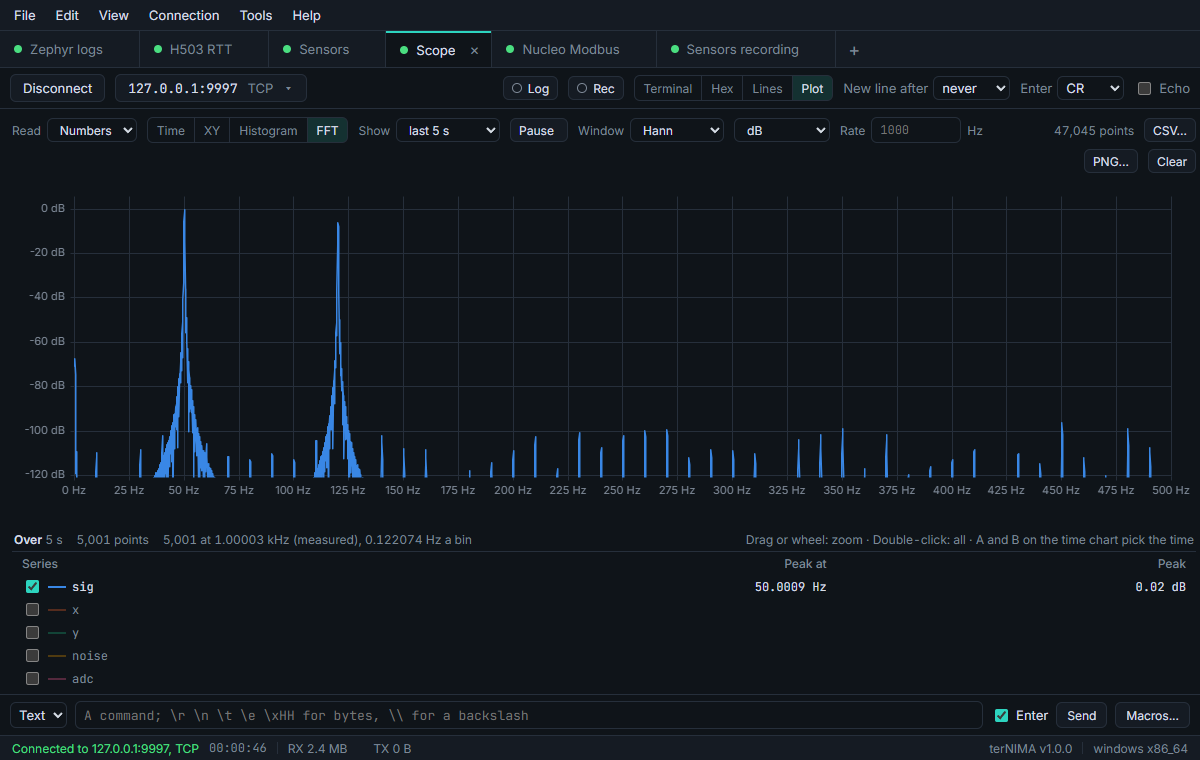
Four charts: Time, XY, Histogram and FFT. Drag or the wheel zooms, Shift+wheel moves, Space pauses, and a double-click follows the newest values again. Clicks place the cursors A and B: the time between them, as a period and a frequency, and each series' value at both; the table under the chart has each one's min, max and mean between them. R by a series puts it on a right axis of its own, for values far from the others. The trigger shows the time around a series crossing a level, rising, falling or either way, as a scope does, and Single holds the first crossing until Arm. CSV... and PNG... save the data and the chart.
Modbus
On serial tabs, View > Modbus (Ctrl+Shift+M) speaks Modbus RTU or ASCII on the tab's own port.
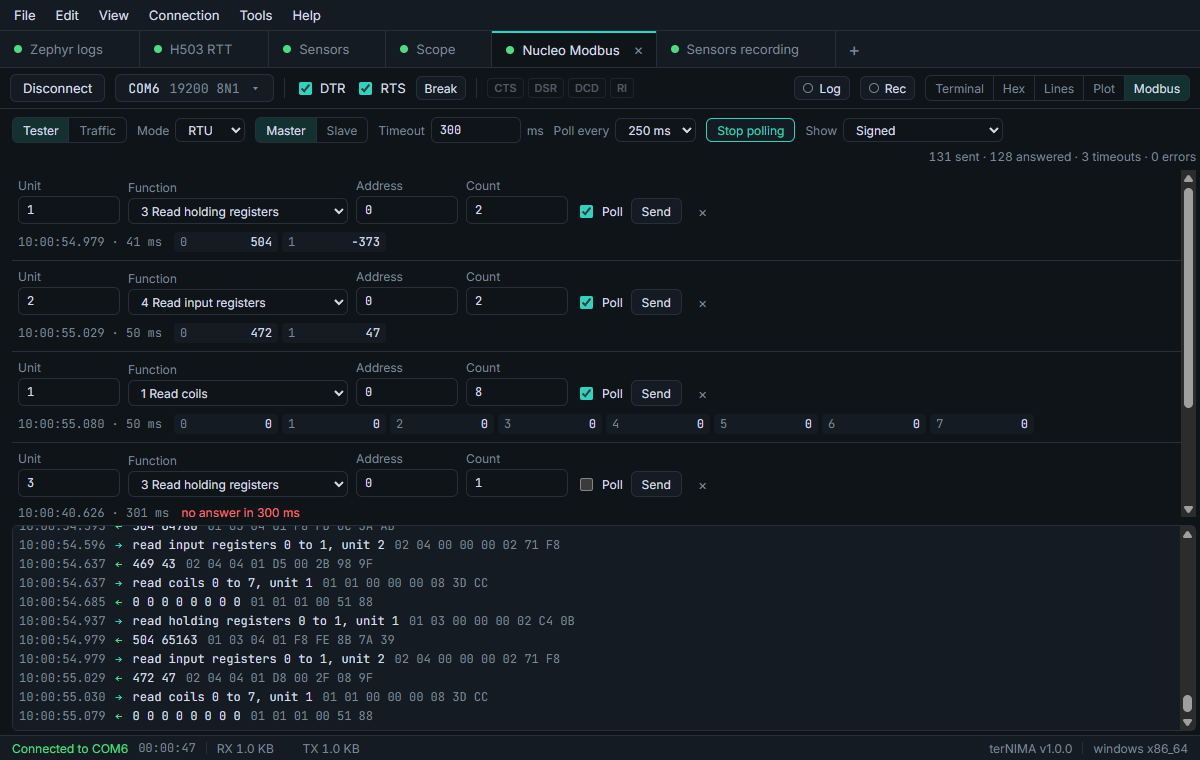
Tester: as a master, a list of requests, functions 1 to 6, 15 and 16, sent one by one or polled; each shows what came back and how long it took, or the exception, or that no answer came. Scan units finds the units that answer. As a slave, it answers a master from tables of registers and coils you can edit.
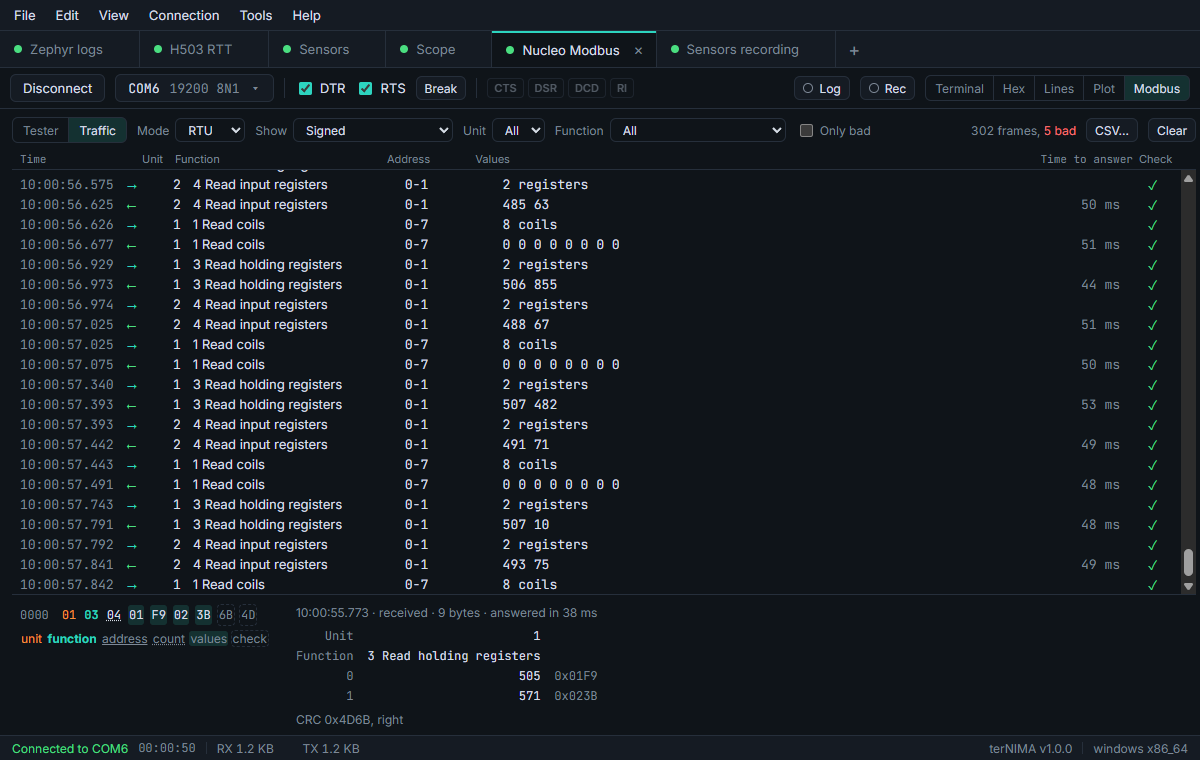
Traffic reads every frame on the line, also between two other devices: each response under its request, checked, with the time it took, the bytes of a frame by part, and CSV.
Log, record and replay
Log in the toolbar (Ctrl+Shift+L) writes what the tab receives to a new file in the log folder, named after the tab and the time: as text, with the colors taken out and the date and time at the start of each line, or raw, every byte as it came. Rec records every byte both ways, with its timing. File > New session > A recording (Ctrl+Shift+O), or A recording under the +, plays one back in a tab of its own, at 0.25× to 100×, from any point.
Settings and the keyboard
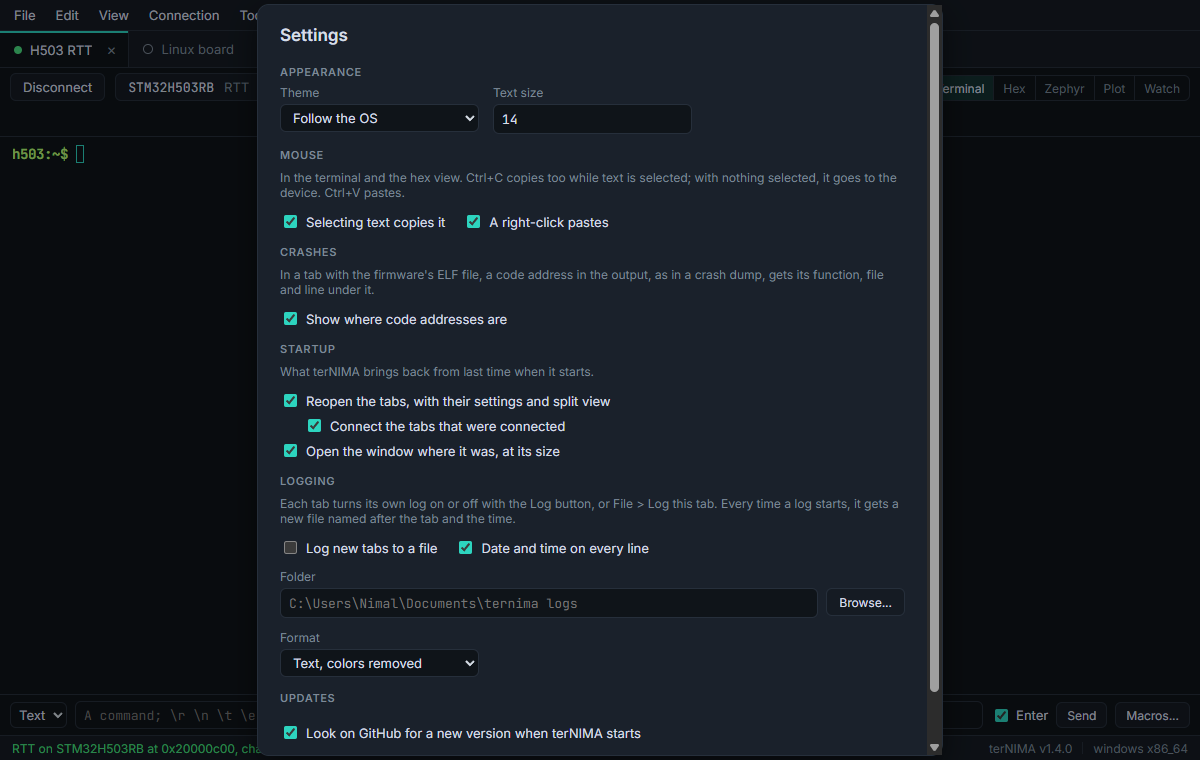
File > Settings (Ctrl+,) has the theme and the text size, what the mouse does in the terminal, crash decoding, what terNIMA brings back when it starts, the log folder and format, and the update check.
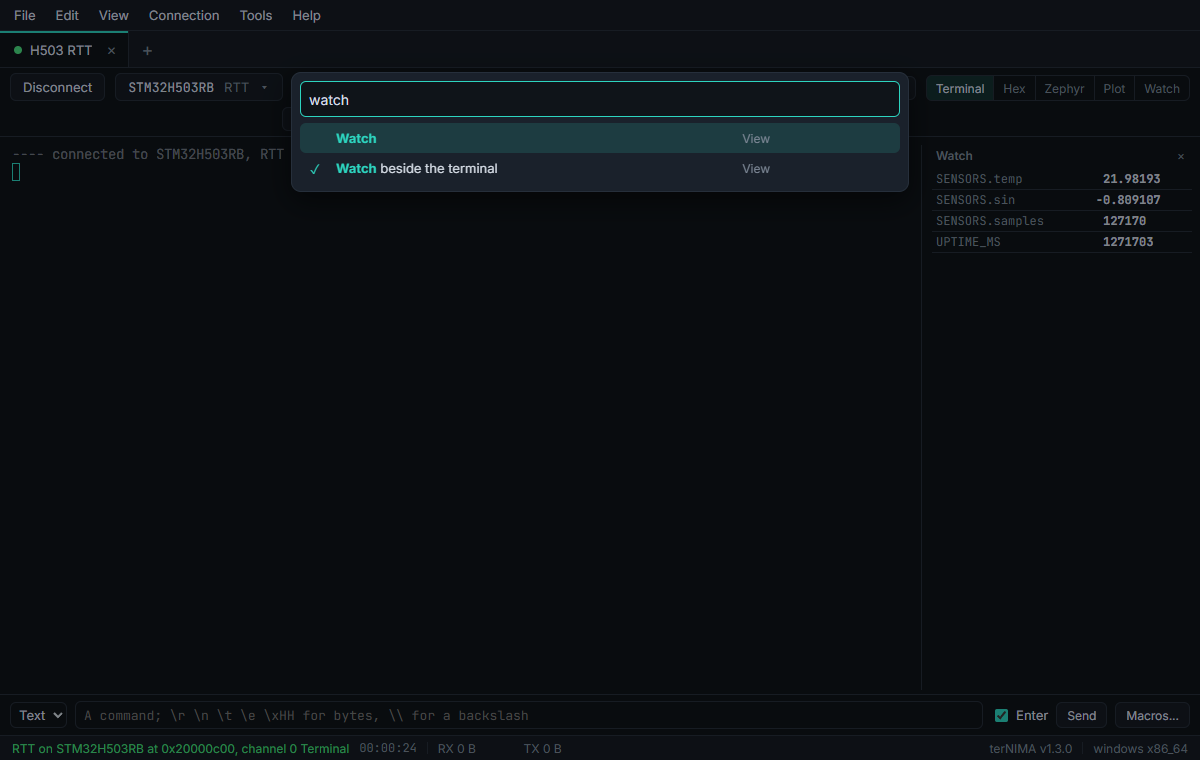
View > Command palette (Ctrl+Shift+P) finds any command by part of its name. The keys:
| Do | Keys |
|---|---|
| New serial, RTT, TCP session | Ctrl+Shift+N Ctrl+Shift+R Ctrl+Shift+T |
| Open a recording | Ctrl+Shift+O |
| Next, previous tab; close it | Ctrl+Tab Ctrl+Shift+Tab Ctrl+Shift+W |
| Copy, paste, select all | Ctrl+Shift+C Ctrl+Shift+V Ctrl+Shift+A |
| Find, next, previous | Ctrl+Shift+F F3 Shift+F3 |
| Clear the screen | Ctrl+Shift+K |
| Hex, Zephyr log, Plot, Modbus | Ctrl+Shift+H Ctrl+Shift+J Ctrl+Shift+G Ctrl+Shift+M |
| Split right, down; the other pane | Ctrl+Shift+E Ctrl+Shift+D F6 |
| Bookmark a line; next, previous | Ctrl+F2 F2 Shift+F2 |
| Log the tab; save the output | Ctrl+Shift+L Ctrl+Shift+S |
| Macros 1 to 9 | Alt+1 … Alt+9 |
| Bigger, smaller, normal text | Ctrl+= Ctrl+- Ctrl+0 |
| Settings; command palette | Ctrl+, Ctrl+Shift+P |
On macOS, Cmd takes the place of Ctrl, and of Alt for the macros. A new serial session, a recording, closing a tab, copy, paste, select all, find and clear take Cmd alone: Cmd+N Cmd+O Cmd+W Cmd+C Cmd+V Cmd+A Cmd+F Cmd+K.
When something goes wrong
- The probe does not open. Another program has it: a debugger in an IDE, STM32CubeProgrammer, or another tab. Close it, or read RTT through the debugger's server. If nothing has it, unplug it and plug it in again. The message in the status bar says why.
- No RTT control block. Is RTT on in the firmware, and has it started? Give the ELF file, or the control block's address. For firmware without RTT, turn Read RTT off and use Watch.
- A serial port is in use. Another program has it open: close it, and terNIMA connects by itself.
- A variable is "not in the ELF". The firmware was built anew: press Reload. Build it with debug information.
- A crash shows no function or line. Is the ELF file in the tab the firmware that runs, and was it built with debug information? Is Settings > Crashes on?
- SSH says a server's key changed. After flashing a board this is expected: the message has the command that takes the old key out. Otherwise, find out why first.
- Anything else: ask, or report a bug on GitHub.